Financial Health Dashboard
You know recurring revenue is growing. You cannot say as quickly whether the SaaS business underneath it is healthy.
DealARR puts revenue, margin, burn, runway, and retention into one financial health dashboard, built from your live deal book and your connected books.
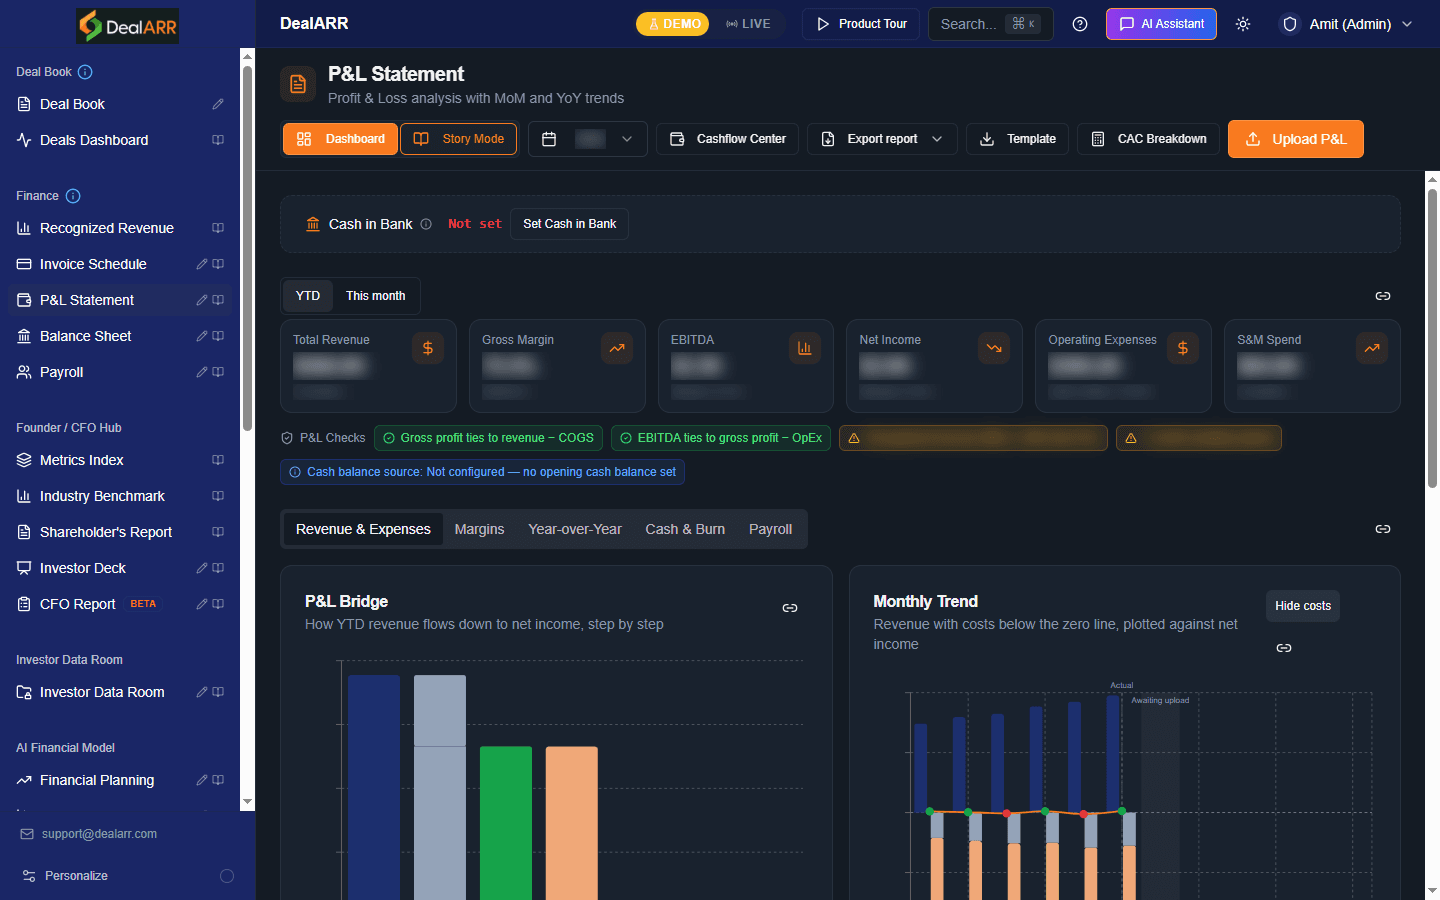
What a Financial Health Dashboard Shows
A financial health dashboard answers a different question from a growth chart. It puts recurring revenue beside margin, burn, runway, and churn, so you can tell whether growth is funded sustainably or bought with cash. DealARR builds the dashboard from your deal book and your connected accounting data, and keeps every figure current as both move. That is the difference between a SaaS company knowing its revenue and knowing its condition.
Revenue from the deal book
Recurring revenue, MRR, and retention calculate from live contracts, so the revenue half of the dashboard never sits a month behind the cost half.
Costs from your books
Operating costs, payroll, and gross margin read from your connected accounting system, so profit sits beside revenue on one dashboard instead of in another tool.
Cash in and cash out
Collections, invoice schedules, and burn rate combine into a cash outlook, so the dashboard calculates runway from real movement rather than a planning assumption made last quarter.
Customer economics included
CAC, payback, and churn join the dashboard, because a SaaS company cannot read financial health without knowing what each customer costs and how long they stay.
Benchmarked, not isolated
Your metrics compare against SaaS industry benchmarks, because the same margin or growth rate means something different at seed than at Series C.
One refresh, every figure
When revenue or costs move, every number on the financial dashboard moves with them. Nobody rebuilds a monthly pack to see the effect of a single change.
One Financial Dashboard for the Whole Business
A financial dashboard covering profit, cash, retention, and efficiency together stops you reading strong revenue while margin quietly falls. Health is a combination, never a single figure. DealARR assembles all of it from one source, so a founder, a finance lead, and a board member read the same SaaS numbers rather than three versions assembled by three people from different exports.
Profit and loss view
Revenue, cost of revenue, operating expense, and gross margin in one dashboard statement, built from live revenue and your connected books.
Balance sheet view
Assets, liabilities, and equity stay current on the dashboard, so the balance sheet is ready when a lender asks rather than assembled on request.
Cash outlook and runway
Expected collections against expected outflows on one dashboard, with months of runway calculated from your real cash position and burn rate.
Burn and efficiency
Net burn, burn rate, and burn multiple show what each unit of SaaS growth is costing the company to buy.
CAC and payback
Customer acquisition cost and CAC payback sit on the dashboard, so you see how long each new customer takes to pay for itself.
Retention and churn
Net revenue retention, gross retention, and churn rate show whether the SaaS company is growing or replacing customers it already had.
Rule of 40 tracking
Growth rate plus profit margin tracked over time, which is the first number most SaaS investors reach for in a diligence call.
Revenue quality view
Recurring against one-time revenue, and contracted against recognized, so the dashboard shows revenue quality and not just revenue volume.
Collections and DSO
Days sales outstanding and aging receivables on the dashboard, because revenue a company has earned but not collected is a cash problem, not a growth story.
Forecast and planning
Forecasts run from live revenue rather than assumptions typed in last quarter, so the plan on the dashboard reflects the business as it stands.
Benchmark comparison
Every metric compares against SaaS industry benchmarks, so a board conversation starts from context rather than from a bare figure.
Five-year model
Five-year AI-modeled SaaS projections through the AI Financial Model Builder add-on, which costs $50 per month flat and is not charged per seat.
Growth, Margin, and Runway in One View
These metrics tell you whether SaaS growth is sustainable rather than simply fast. Every one reads from the same deal book and accounting data, so the dashboard and the board pack cannot disagree about the state of the company. DealARR tracks 96 SaaS metrics in total, and this set is what a founder and a finance lead check first each month.
Who Uses DealARR for Financial Health
Founders, finance leads, and boards read this dashboard for the same SaaS company from three angles. A founder asks whether the runway supports the plan, a finance lead asks whether the numbers tie to the books, and a board asks whether growth is efficient. One source answers all three without a reconciliation step.
Founders and CEOs
You know runway, gross margin, and Rule of 40 without waiting for a month-end pack. When an investor asks how efficiently the company grows, the answer sits on the dashboard and traces back to real contracts and ledger entries rather than to a spreadsheet nobody else can open.
Finance and CFO leads
Profit, cash outlook, and SaaS metrics read from one source, so monthly reporting stops being an assembly job. Forecasts update from live revenue instead of assumptions typed in last quarter, and the dashboard your team reviews is the one the board receives.
Boards and investors
Board packs and investor updates generate from the same figures the company runs on, so nothing gets reconciled after the fact. Growth, burn rate, churn, and margin appear together, which is how a board judges whether a SaaS business is actually healthy.
Frequently Asked Questions
Common questions about the DealARR financial health dashboard and where its numbers come from.
What is a financial health dashboard?+
Which metrics show SaaS financial health?+
Where does the dashboard data come from?+
How is cash runway calculated?+
Does this replace my accounting system?+
Can I share the dashboard with my board?+
Does it track customer economics as well as cash?+
Can I compare against industry benchmarks?+
How much does the dashboard cost?+
See Your Financial Health from Day One
Connect your deals and your books, and DealARR assembles the whole SaaS picture on one dashboard: revenue, gross margin, burn rate, runway, churn, and retention together.
Start Free Trial30-day free trial · up to 5 users · no credit card