SaaS Reporting Tool
Every SaaS metric your board asks for lives in a different spreadsheet, and by the second month they no longer agree.
DealARR calculates your SaaS metrics from one live deal book and produces the reporting you currently rebuild by hand every month.
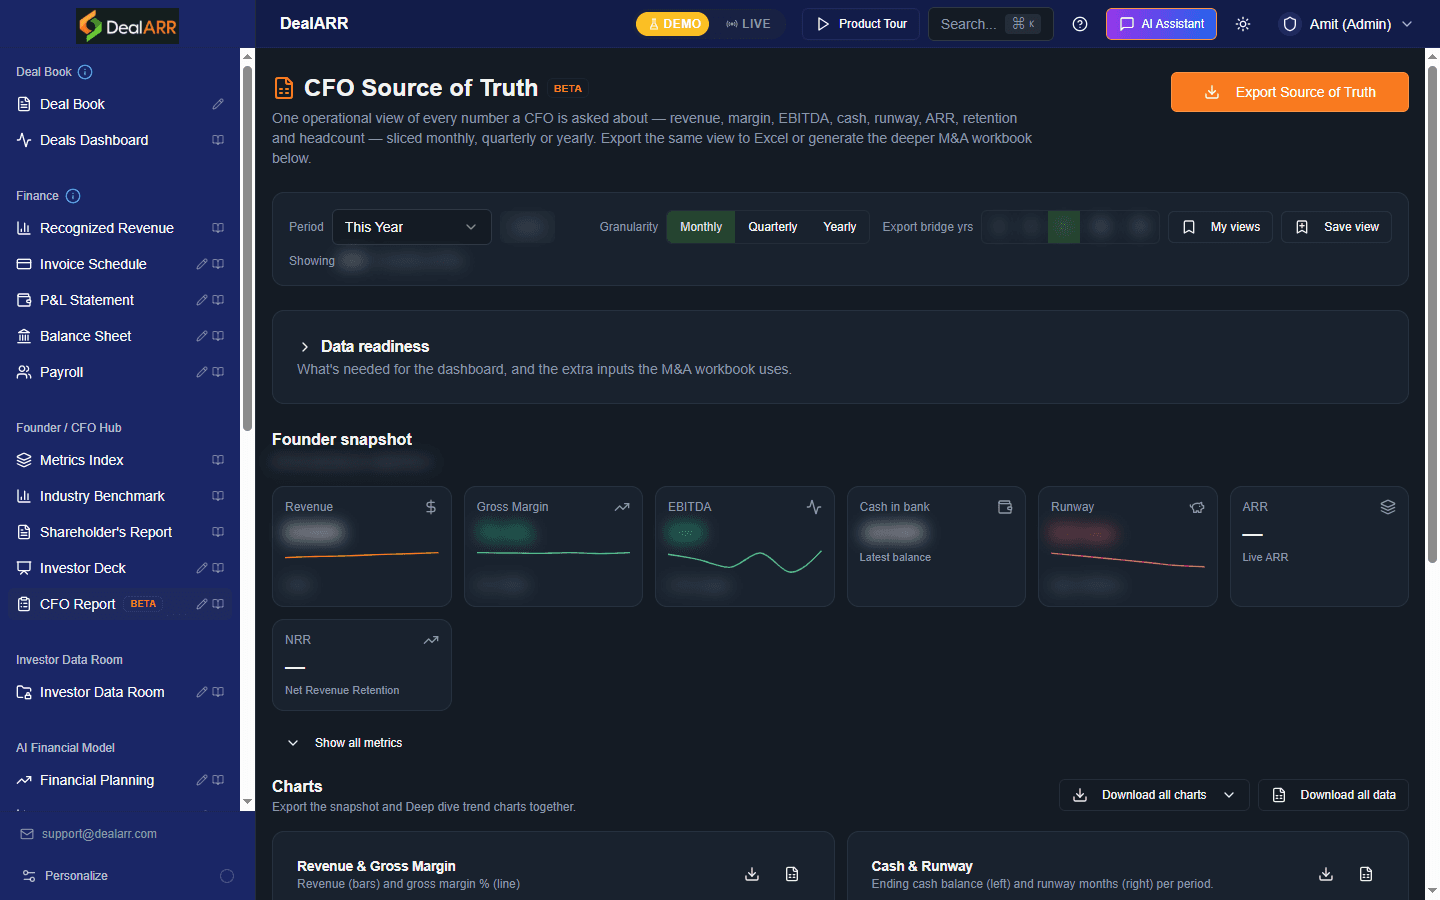
What a SaaS Reporting Tool Does
A SaaS reporting tool turns subscription and contract data into the metrics a software business actually runs on. It reads your recurring revenue, applies one definition per metric, and keeps every number current as customers upgrade, downgrade, and churn. DealARR does that from the live deal book, so the figure in a board pack is the figure on the screen. SaaS reporting then never needs a reconciliation step first, because one source of data feeds all of it.
Reads your live deal book
Every SaaS metric derives from contracts your business already holds, with their values, terms, and statuses. Nothing gets typed in twice, so nothing gets typed in wrong, and no reporting cycle starts with a data-gathering week.
One definition per metric
Each SaaS metric carries a single formula used everywhere. Retention in your reporting and retention in an investor update are the same calculation, not two interpretations produced by two people working from different exports.
Updates as customers change
An upgrade, downgrade, or cancellation flows through every affected SaaS metric at once. Churn, growth, and recurring revenue move together in your reporting rather than on three separate refresh cycles.
Segment and cohort views
Read any SaaS metric by customer, product, plan, segment, or owner, and group customers into cohorts by the month their subscription started, so reporting answers questions about parts of the business.
Benchmarked against the market
Your numbers sit beside SaaS industry benchmarks, so a growth or retention rate reads in context. Reporting a figure without a benchmark tells a board what happened but not whether it was good.
Share as a report
The same data feeds board reports, shareholder reports, and investor decks, so sharing becomes a step rather than a separate build. That is what SaaS reporting should cost your team in time.
SaaS Reporting Built on Live Revenue Data
SaaS reporting goes wrong when each report gets built separately. One person pulls recurring revenue from billing, another pulls churn from the CRM, and by month two the two disagree about the same customers. DealARR derives every SaaS metric from the same deal data, so the reports cannot drift apart. Finance, revenue operations, and the board read one set of numbers, and any team can trace a figure back to the contracts behind it.
Full SaaS metrics library
96 SaaS metrics come defined and calculated, so no data model needs designing before anyone reads a number or builds reporting.
Revenue and growth metrics
Recurring revenue and MRR with their new, expansion, contraction, and churn movements, plus the period-over-period growth rate a SaaS board expects.
Retention and churn metrics
Net and Gross Revenue Retention, logo churn, and revenue churn from the deal book. Every SaaS investor conversation opens with this pair of numbers.
Unit economics
CAC, LTV, LTV to CAC, and CAC payback, so SaaS growth reads next to what acquiring those customers actually cost the business.
Efficiency metrics
Rule of 40, burn multiple, and quick ratio show whether SaaS growth is being funded sustainably or simply bought with cash.
Cohort reporting
Group SaaS customers by start month, product, or plan, then compare how each cohort retains and expands across time in one view.
Drill down to the deal
Click any SaaS metric and reach the deals behind it. Every number traces to real contracts rather than being defended from memory in a meeting.
Customer-level reporting
See recurring revenue, churn risk, and expansion per customer, so account reviews run on reporting rather than on impressions.
Product and plan reporting
Compare growth, churn, and pricing performance across products and plans to see which parts of the SaaS business are working.
Board and investor reporting
Board packs, shareholder reports, and investor decks generate from the same SaaS metrics, so no document contradicts another one.
Historical trend tracking
Every SaaS metric keeps its history, so reporting shows a multi-quarter trend rather than a single point in time with no context.
Not a BI project
DealARR is not a general-purpose analytics build. SaaS metrics arrive pre-defined, which is why teams get reporting in days. These are the metrics reporting tools finance asks for.
The Metrics Reporting Tools Finance Needs
Metrics reporting tools should cover revenue, retention, and efficiency together, not simply draw a revenue chart. Every SaaS metric here calculates from the same deal data and refreshes as customers change, so a finance team tracks growth and churn on one screen without exporting anything. DealARR tracks 96 SaaS metrics in total, and this set is the group most SaaS businesses report to a board each quarter.
Who Uses DealARR SaaS Reporting Tools
Founders, finance teams, and revenue operations leaders use these SaaS reporting tools for one shared set of metrics. Each reports to a different audience: a board, an auditor, or an account team. Because every number comes from the same deal data, the same figures hold up in all three rooms without anyone translating between two tools first. That matters most in the weeks when a fundraise, an audit, and a quarterly review all land together and nobody has time to reconcile three versions of the same SaaS metric.
Founders and CEOs
You walk into the board meeting with SaaS metrics current that morning. Growth, retention, and efficiency come from the deal book, so a challenged figure traces back to real contracts instead of being defended from memory, and reporting stops being a weekend job before every meeting.
Finance and CFO teams
Your monthly SaaS reporting stops being a rebuild. Recurring revenue, retention, and unit economics recalculate as deals change, so the pack becomes a review step and your team gets those days back every single month of the year.
RevOps and CS leaders
You read retention and expansion by segment, product, and owner without waiting on finance. SaaS churn and retention update as renewals and downgrades land, so an at-risk pattern in a customer cohort surfaces while there is still time to act on it.
Frequently Asked Questions
Common questions about SaaS reporting and how DealARR calculates your metrics.
What is a SaaS reporting tool?+
Which SaaS metrics should you track?+
How do SaaS reporting tools improve decisions?+
How do I choose a SaaS reporting tool?+
Can I share reporting with my board and investors?+
Can I report by customer, product, or segment?+
Does the reporting track cohorts over time?+
Does it replace my accounting or BI tool?+
How current is the SaaS reporting?+
How much does the SaaS reporting tool cost?+
Report SaaS Metrics from One Source
Connect your deals and DealARR calculates every SaaS metric for you, then builds the board and investor reporting from exactly the same data your team reads all month. You start from a defined metrics library rather than a blank analytics project, so the first reporting pack is ready in days.
Start Free Trial30-day free trial · up to 5 users · no credit card